How to use HDD/SSD/RAID by blockchain, what is FromHDDtoSSD?
A drive failure prediction by SORA Neural Network
usage: A drive failure prediction by SORA Neural Network
First is the setting. Open "failure prediction settings" from the top menu.
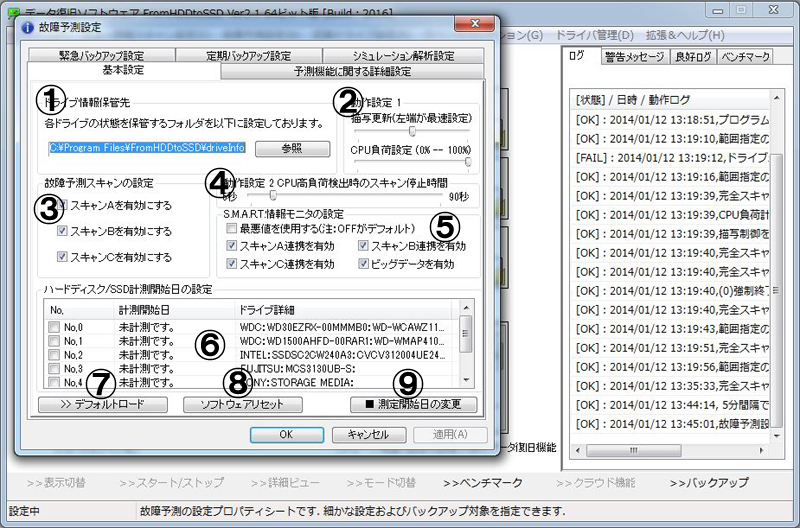
* No.1: Blockchain storage location.
It can specify the path of the Blockchain. Of course, it can also be specified from the command line (-datadir).
* No.2: It is the setting of the software drawing interval and the CPU load to stop scanning.
If the depiction is heavy, it will be more comfortable to reduce this depiction interval. It is measuring the CPU load, and scanning will be paused when it exceeds a certain level. It can set that threshold here.
* No.3: Enable or disable the failure prediction scan executed during drive failure prediction.
The load of Scan-C tend to be high. It is recommended to enable it in order to detect bad sectors as soon as possible.
* No.4: When a high CPU load is detected in No.2, it can set the time to stop scanning.
As it is related to accuracy, please leave as it is unless there is a particular problem.
* No.5: S.M.A.R.T. information monitor settings for drive failure prediction.
It controls the interlocking of S.M.A.R.T. and failure prediction scan. Unless there is a particular problem, please leave as it is.
* No.6: Represents the date and time when the storage failure prediction started.
Since it is controlled for each drive, it is also for each drive.
* No.7: This is the default load for this page only.
It can reset the settings to the initial state, so if something goes wrong, load it by default here.
* No.8: This is the default load for the entire drive failure prediction.
It can also restore the settings here, so if something goes wrong, click here.
* No.6: Check the left end and click No.9 to change the failure prediction start date and time.
Unless there is a particular problem, please leave as it is. It will affect the calculation of the failure date.
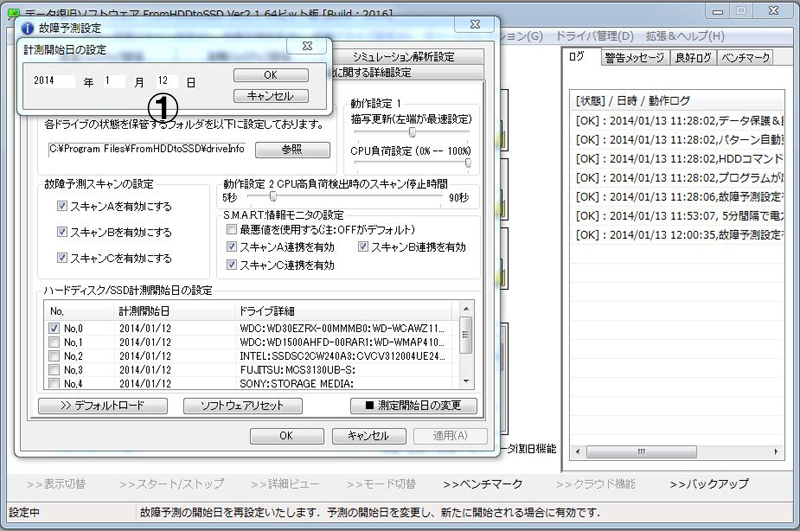
* No.1: Change the date and click the "OK" button.
This will change the failure prediction start date and time.
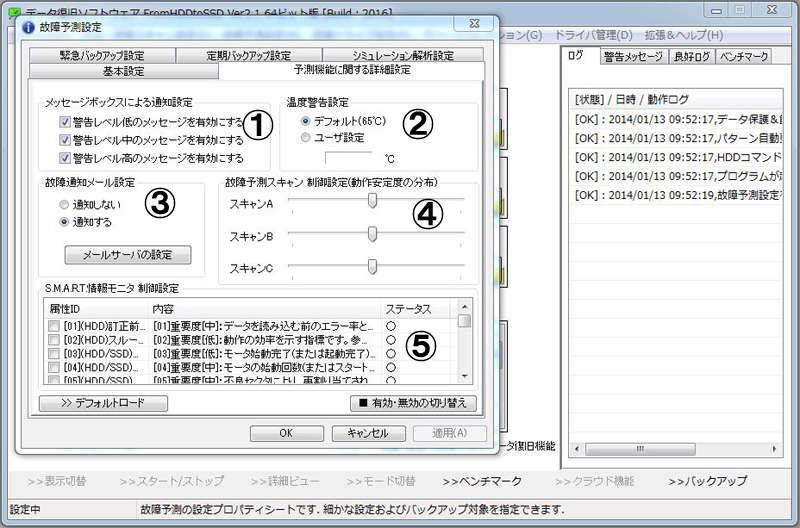
* No.1: Change the date and click the "OK" button.
The warning level varies depending on the situation and can be adjusted individually.
* No.2: It can adjust the temperature of the drive that is judged to be in the warning stage.
If there is no particular impact, please leave as it is.
* No.4: It can adjust the distribution of failure prediction scans.
It is a remnant of the time when it was adjusted in the past, and now can be fully operated in the center.
* No.5: It can enable / disable the S.M.A.R.T. attribute. It can switch by checking the box on the left side and clicking "Enable/Disable" below it.
It will set the backup items. (There are two types, emergency and periodic backup)
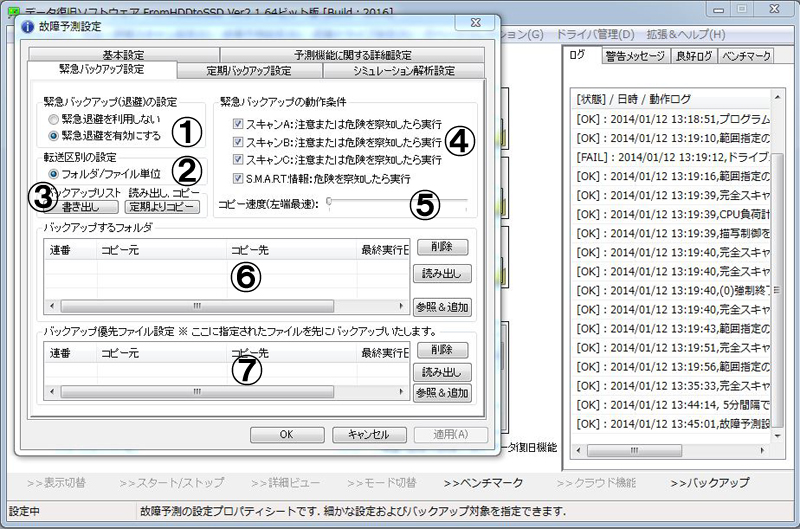
* No.1: It can enable or disable emergency backup.
Emergency backup is an automatic backup feature that is executed when is really dangerous.
* No.2: Please leave as it is.
* No.3: It can write the contents registered in each list to text.
* No.4: It can set when to activate this backup.
* No.5: It can adjust the speed of file copy.
Other work will be affected during the backup. At that time, the backup speed can be reduced.
* No.6: Specify each file to be backed up in folder units.
It can be specified with the "Delete", "Read", and "Browse & Add" buttons. The delete button can be deleted line by line. For reading, register the text written in No. 3. For browsing & adding, the folder selection dialog will appear.
* No.7: Specify the files you want to preferentially back up in file units.
This will be backed up first.
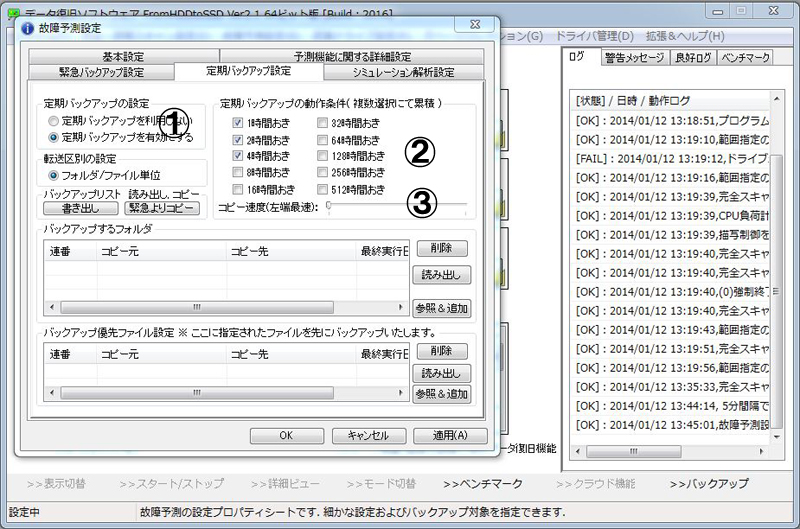
* No.1: It can enable or disable regular backups.
Periodic backup is a feature that back up at regular intervals that have been set.
* No.2: It can set the interval.
It has adopted a cumulative check.
* No.3: It can adjust the speed of file copy.
Adjust the copy load to create a comfortable environment.
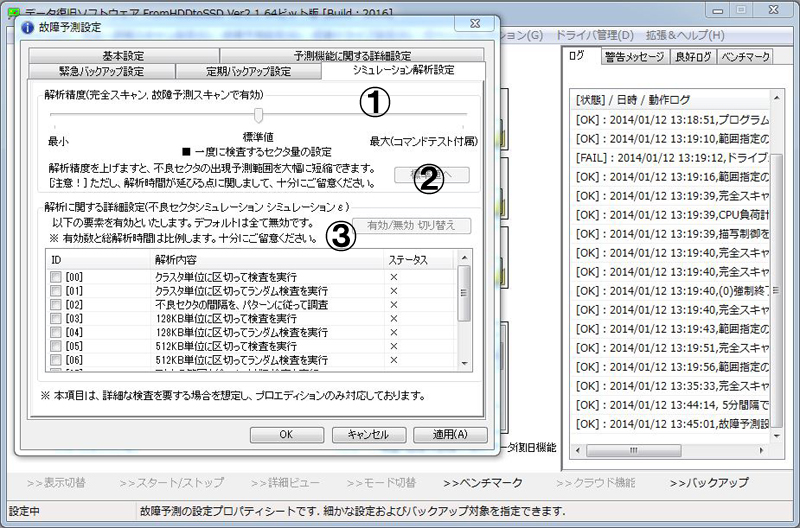
* No.1: It can set the unit of the number of sectors to be scanned.
Unless there is a particular problem, please leave the settings as they are.
* No.2: The setting value of No.1 can be restored.
If you have any problems, it will fix them and deal with them.
* No.3: It can increase the number of analysis items for bad sector simulation.
It can switch by checking the check box on the left side of each list and clicking the "Enable/Disable" button.
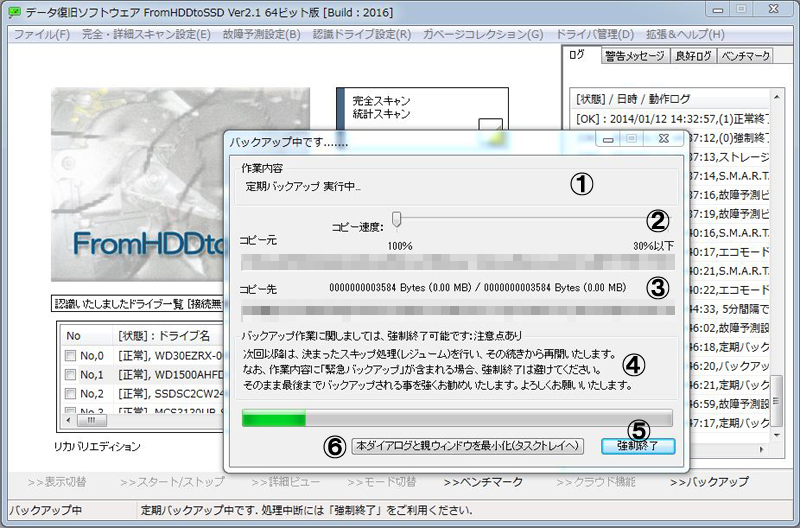
* No.1: Shows the current backup status.
* No.2: The copy speed is set.
It can change immediately even during backup.
* No.3: denotes the progress.
It will inform you of the copy status by displaying both the copy source and copy destination.
* No.4: Notes on backup.
* No.5: Backup will be forcibly terminated.
* No.6: Enter the task tray.
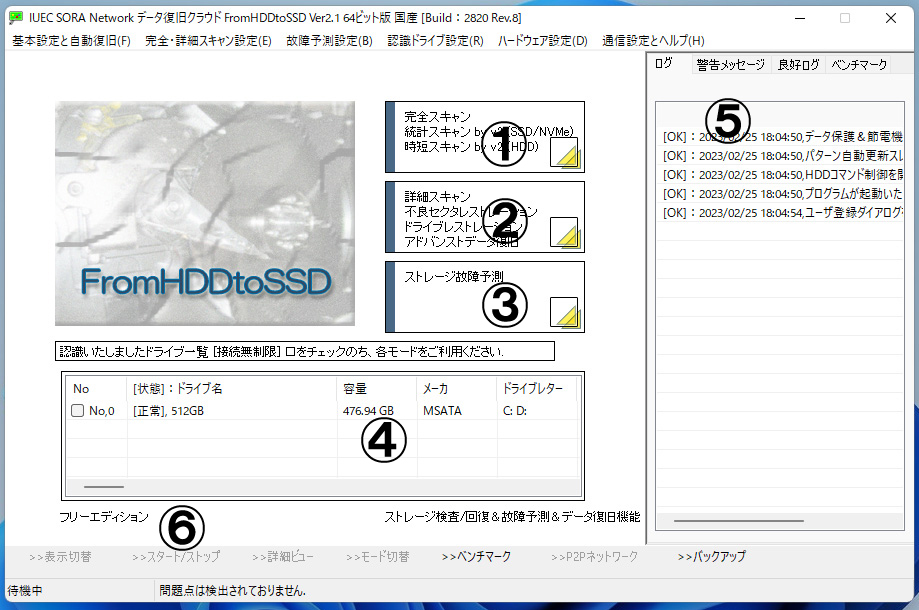
* No.3: Left-click to activate drive failure prediction.
◇ No.6: It can run a periodic backup at any time with the backup button.
It can back up at any time and keep your backup data up to date.
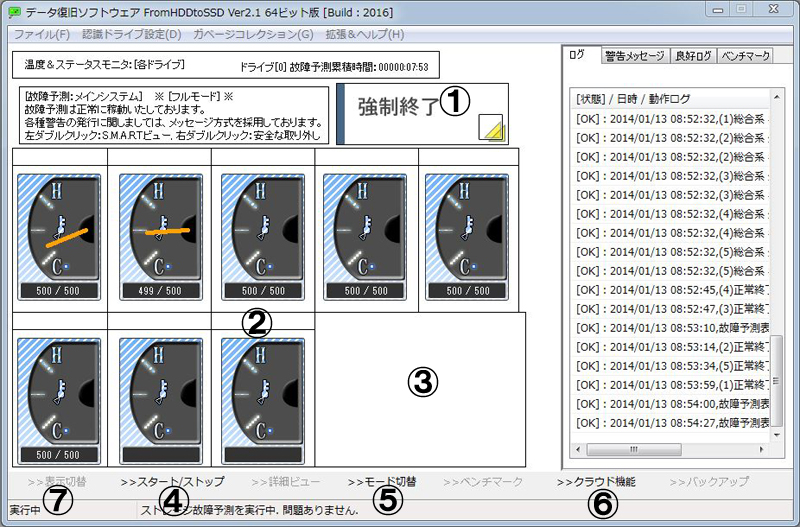
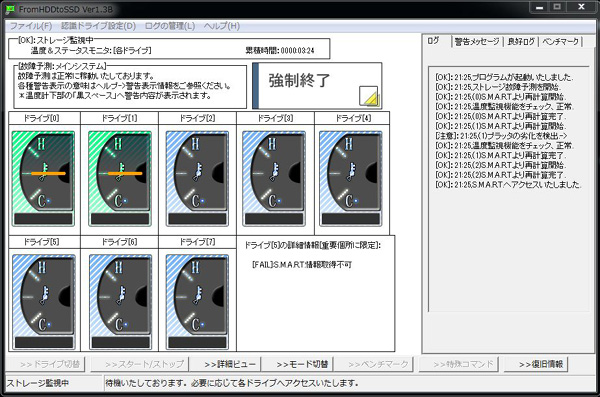
* No.1: It can forcibly terminate by left-clicking.
* No.2: Shows the temperature of each drive.
When it reaches the center, the temperature becomes appropriate.
* No.3: Place the cursor on the thermometer to simply display the information on drive.
It will display the most important part of the S.M.A.R.T. information.
* No.4: This button allows you to pause the entire failure prediction.
All getting data and failure prediction scans can be paused/resume.
* No.5: The display mode of failure prediction will be switched.
There are two types, a failure prediction scan monitor and an S.M.A.R.T. information monitor, and you can switch to that.
* No.6: A feature that can display statistics introduced in storage failure prediction.
If the statistics cannot be received, it will operate as usual failure prediction.
* No.7: If there are 9 units or more drives connected, it will be switch between them.
Up to 8 units can be displayed at one time.
◇ No.5: Left-click to move to the failure prediction scan monitor.
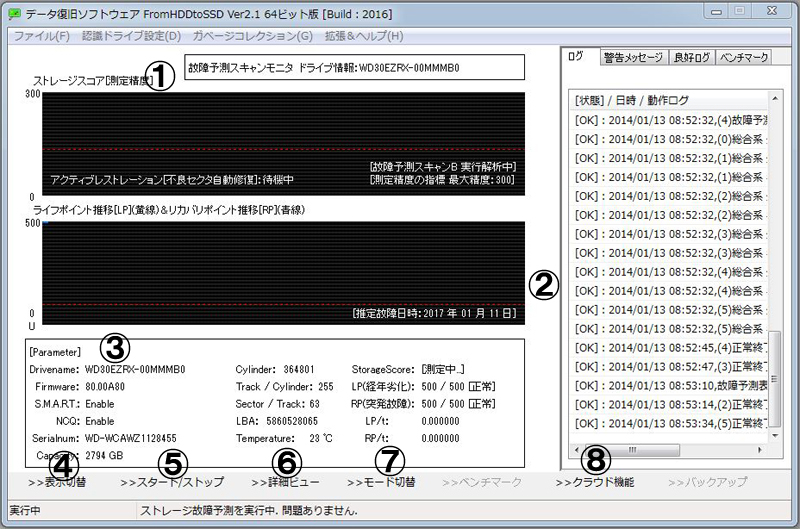
* No.1: Graph is of the storage score that quantifies the current state of the drive.
* No.2: LP, RP graph that quantifies the degree of drive deterioration.
Both have a maximum value of 500. From here, it will look at the degree of deterioration while reducing the values.
* No.3: Drive information is arranged in a simple.
* No.4: Used to switch the drive to be displayed.
* No.5: This button allows you to pause the entire failure prediction.
Getting data and failure prediction scans can be paused/resumed.
* No.7: The display mode of failure prediction will be switched.
Proceed to S.M.A.R.T. Information Monitor.
* No.8: A feature that can display statistics introduced in storage failure prediction.
If the statistics cannot be received, it will operate as usual failure prediction.
* No.6: Starts the S.M.A.R.T.-view of the displayed drive.
It is equipped with the S.M.A.R.T.-view that allows you to see drive information in more detail.
◇ No.7: Left-click to move to the S.M.A.R.T. information Monitor.
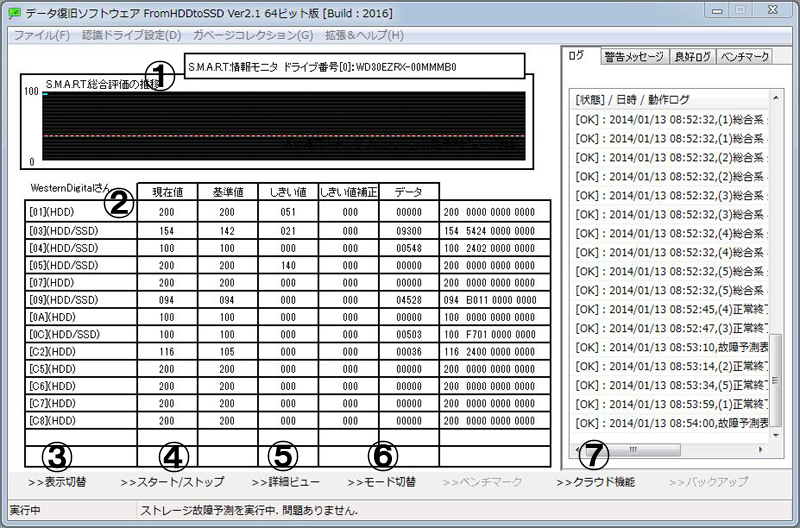
* No.1: It analyze each S.M.A.R.T. attribute and guide the comprehensive evaluation.
* No.2: The S.M.A.R.T. attributes participating in the storage failure prediction are displayed.
* No.3: Used to switch the drive to be displayed.
* No.4: This button allows you to pause the entire failure prediction.
Getting data and failure prediction scans can be paused/resumed.
* No.5: Starts the S.M.A.R.T.-view of the displayed drive.
It equipped with the S.M.A.R.T.-view that allows you to see drive information in more detail.
* No.6: The display mode of failure prediction will be switched.
Return to thermometer mode.
* No.7: A feature that can display statistics introduced in storage failure prediction.
If the statistics cannot be received, it will operate as usual failure prediction.
◇ No.2: Double-click the attribute ID part to start the failure prediction view.
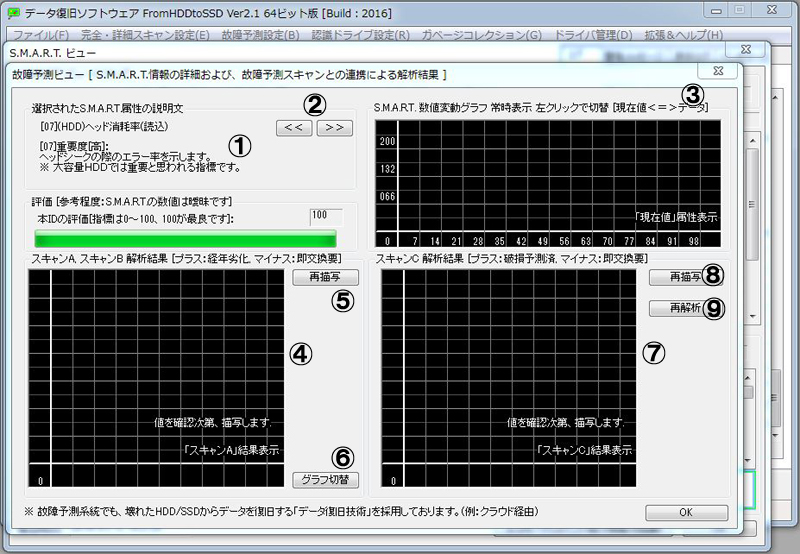
* No.1: This is an explanation of this attribute ID.
* No.2: It becomes an attribute move button.
It can move the attribute ID with this button.
* No.3: This is a graph of changes in the S.M.A.R.T. attribute.
The numerical value on the X-axis of the graph indicates the number of acquisitions. It can switch between the current value and the data by left-clicking on the graph itself.
* No.4 and No.7: Graph the results of failure prediction scans
No.5 and No.8: Re-depiction, No.6 and Mo.4: Switch graphs.
No.4 is shared by Scan A and Scan B, so a switch button was required.
* No.9: This button forcibly advances the failure prediction by one step.
This feature is for debugging.